
Agricultural
Communication
Biosci. Biotech. Res. Comm. 9(3): 445-456 (2016)
Expression analysis of salt stress related expressed
sequence tags (ESTs) from
Aeluropus littoralis
by
quantitative real-time PCR
S. H. Hashemipetroudi
1,4
*, G. Nematzadeh
1
, G. Ahmadian
2
, A. Yamchi
3
and M. Kuhlmann
4
1
Genetics and Agricultural Biotechnology Institute of Tabarestan (GABIT), Sari Agricultural Sciences and
Natural Resources University, PO Box 578, Sari, Iran
2
National Institute of Genetics Engineering and Biotechnology (NIGEB), Tehran, Iran
3
Department of Plant Breeding and Biotechnology, Gorgan University of Agricultural Sciences & Natural
Resources, Gorgan, Iran
4
RG Abiotic Stress Genomics, Leibniz Institute of Plant Genetics and Crop Plant Research (IPK), Gatersleben,
Germany
ABSTRACT
Aeluropus littoralis is a monocot halophyte grass and provide valuable genetic resources for understanding the molecular mecha-
nisms of stress-responsive genes, and improving tolerance to abiotic stresses in economically important crops. In an attempt to
identify salt stressed responsive genes, 154 isolated expressed sequence tags (EST) from A. littoralis were bioinformatically ana-
lyzed and functionally annotated. Of the 129 assembled unique transcripts, 111 (86%) and 18 (14%) comprised of singletons and
contigs, respectively. Among them, 58.9% could be assigned a putative identity, 20.9% with hypothetical or unknown functions
and 20.9% showed no match with existing sequences. Expression pattern of 41 selected ESTs were estimated by quantitative real-
time polymerase chain reaction (qPCR) in two different tissues. Expression pro ling were undertaken in control and three time
point of salt stress (6hrs, 24hrs and one week) followed by three time point of recovery condition (6hrs, 24hrs and one week). In the
root, the genes of SAMDC, ISB1 (6hrs), PP2C and SelO, HsfA1a, TFC D, Katanin, F-box were signi cantly up-regulated relative to
control while LecRLKs, ARP, HP3, PICKLE, Utp20, SYP81, CIPK20, HAK18, VDAC3, SND1, NAP1, ISB1 (6hrs and 24hrs), NUC2,
MUT, HP1 and PIP1;3 showed down-regulation in given conditions. In the case of leaf tissue, the genes of PP2C, SelO, Utp20,
SND1, PITP, LecRLKs, STPK, KCNK12, HsfA1a, HAK18, NUC2, ARP, HP3 and ARP were signi cantly up- or down-regulated.
Differential regulation of these genes were observed in root and tissue which con rm their role in salt stress tolerance. This func-
tionally annotated EST and gene expression pro ling provide initial insights into the transcriptome of A. littoralis.
KEY WORDS:
AELUROPUS LITTORALIS
, GENE EXPRESSION, SALT STRESS, RECOVERY CONDITION
445
ARTICLE INFORMATION:
*Corresponding Author: shr.hashemi@sanru.ac.ir
Received 1
st
Aug, 2016
Accepted after revision 5
th
Sep, 2016
BBRC Print ISSN: 0974-6455
Online ISSN: 2321-4007
Thomson Reuters ISI ESC and Crossref Indexed Journal
NAAS Journal Score 2015: 3.48 Cosmos IF : 4.006
© A Society of Science and Nature Publication, 2016. All rights
reserved.
Online Contents Available at: http//www.bbrc.in/

446 EXPRESSION ANALYSIS OF
AELUROPUS LITTORALIS
ESTS BIOSCIENCE BIOTECHNOLOGY RESEARCH COMMUNICATIONS
Hashemipetroudi et al.
INTRODUCTION
The global climatic changes, such as prolonged drought,
temperature change and increasing salinity, cause to
a serious challenge for agricultural production world-
wide, affecting plant growth and yield. Drought and
salinity are becoming particularly widespread in many
regions, and may cause serious salinization of more than
50% of all arable lands by the year 2050. Therefore it
is important to secure food production for a growing
world population by increasing the yield of crop plants
while resources become more restricted (Yamaguchi and
Blumwald, 2005, Pitman and Läuchli, 2002 and Mittler
and Blumwald, 2010).
The discovery of novel stress-responsive genes, iden-
ti cation of new cis-and trans- acting elements that are
involved in stress adaptation provide an opportunity for
generating stress tolerance crops (Cushman and Bohnert,
2000, Patnaik and Khurana, 2001, Ben-Saad et al., 2012
and Hashemi et al., 2016).
The use of wild plant species or halophytic rela-
tives has been considered in plant breeding programs
for developing salt and drought tolerant crops Utilising
such approach, Aeluropus littoralis can serve as a halo-
phyte model for identi cation and isolation of the novel
adaptation genes. Aeluropus littoralis is a perennial
monocot grass with the small haploid genome of 349
Mb, using the C
4
mechanism for carbon xation (Wang,
2004). Aeluropus littoralis grows in dry salty areas or
marshes (Saad et al., 2011) and can survive where the
water salinity is periodically high (Mesléard et al., 1993)
and tolerate up to 1100 mM sodium chloride (Barhoumi
et al., 2007). Therefore, A. littoralis serves as valuable
genetic resource for understanding the molecular mech-
anisms of stress-responses in monocots, and can poten-
tially be used for improving tolerance to abiotic stresses
in economically important crops (Saad et al., 2010).
The process of identifying new genes and character-
izing their functions generally is done at three molecular
biology levels viz: genomics, transcriptomics and prot-
eomics. Transcriptome-based gene discovery in response
to environmental stress offers insights into the roles of
the transcriptome in the regulation of physiological and
biological responses (Gracey, 2007). Because these meth-
ods strictly clarify changes in transcript level, a com-
plex multi-component process, such as salt and drought
stress, can be broken into their basic element (Umezawa
et al., 2002). Partial cDNA isolation often known as
expressed sequence tags (ESTs) is the rapid and cost-
effective Transcriptome-based gene discovery method
that has become an ef cient approach for identifying of
coding regions in a wide spectrum of organisms.
Various techniques such as differential display PCR
(DDPCR) (Hubank and Schatz, 1994), cDNA-ampli ed
fragment length polymorphism (AFLP) (Bachem et al.,
1996), suppression subtractive hybridization (SSH)
(Diatchenko et al., 1996), serial analysis of gene expres-
sion (SAGE) (Velculescu et al., 1995), massively parallel
signature sequencing (MPSS) and recently whole tran-
scriptome pro ling (RNA-Seq) (Brenner et al., 2000)
have been used for EST isolation. By use of these tech-
niques a large number of genes expressed during differ-
ent developmental, differentiation and growth stages or
in response to a variety of biotic and abiotic stresses has
already identi ed in plants (Priya et al., 2012). It is clear
now, the most biological processes, growth and develop-
mental programming are regulated by the precise control
of genetic expression (Agarwal et al., 2008). Genome-
wide analyses of mRNA level showed that the expression
level of genes may be changed (up or down-regulation)
in response to different condition (Rabbani et al., 2003),
in some case differential regulation of speci c genes and
pathways can lead to adaptation of crop genotypes to
different abiotic stress (Aglawe et al., 2012).
To gain insight into these processes, it is necessary
to study patterns of gene expression. Quantitative real-
time polymerase chain reaction (qPCR) analysis is one of
the most currently used approaches for measuring gene
expression level (Gutierrez et al., 2008). The sensitivity,
speci city and simplicity of this technique is incompa-
rable with other methods such as Northern and in situ
hybridization, RNase protection assays and semi-quan-
titative reverse transcription- polymerase chain reaction
(RT-PCR) (Bustin, 2000).
In our pervious study (Fatemi et al 2016.), 154 ESTs
(relative to salt and drought stresses) have been isolated
from A. littoralis by cDNA-AFLP and their sequences
were deposited in dbEST database (NCBI; www.ncbi.nlm.
nih.gov/dbEST). The primary goal of this investigation
was to annotate and assign putative functions of 154
isolated ESTs. Also, expression pattern of selected ESTs
was analyzed in two different tissues of A. littoralis at
salt stress and recovery condition.
MATERIAL AND METHODS
Aeluropus littoralis seeds were collected from Isfahan
province (Roddasht region) in Iran and the sterilized
seeds plated on full strength MS medium (Murashige
and Skoog, 1962) with vitamins, 3% sucrose and 0.7%
agar (pH 5.8). The cultures were incubated in germina-
tor at 25 ± 2 C with 16 h light/8 h dark photoperiod at
100 mol m
-2
s
-l
photon ux density using cool-white
uorescent light. Two weeks after germination, the seed-
lings were transferred to hydroponic culture containing
Hoagland’s solution (Hoagland and Arnon, 1950). The
30 day-old seedlings were stressed in 600 mM of sodium

BIOSCIENCE BIOTECHNOLOGY RESEARCH COMMUNICATIONS EXPRESSION ANALYSIS OF
AELUROPUS LITTORALIS
ESTS 447
Hashemipetroudi et al.
chloride at six passages (received 100 mM sodium chlo-
ride per 48 hrs up to 600 mM). At the end of the sixth
passage, salt stress samples were collected at 6hrs (S1),
24hrs (S2) and one week (S3) time point. In order to
plant recovery, the remained plants were transferred to a
sodium chloride-free Hoagland’s solution, and then were
collected after 6hrs (R1), 24hrs (R2) and one week (R3).
Leaf and root were sampled in parallel. Control sam-
ples were taken from unstressed plants at the start of
the experiment. All samples were immediately frozen in
liquid nitrogen and stored at -70°C for RNA extraction.
The EST sequences of Aeluropus littoralis were
retrieved from EST database at NCBI and were analyzed
using the BLASTN, tBLASTX and BLASTX algorithms
(Zhang et al., 2000). The database of gene ontology
(http.//www.geneontology.org) was used to investigate
the molecular function of each EST and its role in bio-
logical processes as well as its location in the cell. After
selection of candidate reference genes, the gene-speci c
primers were designed using the Primer 3 software
(Rozen and Skaletsky, 1999), and were synthesized by
Metabion GmbH (Martinsried, Germany). All designed
primers had 18-24 length, GC content ranging from 42%
to 61% and similar melting temperatures (55-64°C). The
amplicon length ranged from 60 to 282 bp. The primer
sequences and GenBank accession numbers of related
genes are presented in Table 1. The primer speci city
was evaluated by melt curve analysis, and size of the
amplicons was tested by end-point PCR on 3% agarose
gels.
Total RNA was extracted using TRIzol reagent (Inv-
itrogen Life Technologies, Karlsruhe, Germany) accord-
ing to the manufacturer’s instructions. The quality and
quantity of the extracted ribonucleic acid was checked
by measuring absorbance at 260/280 nm using a Nan-
oDrop spectrophotometer (Biochrom WPA Biowave II,
UK). Further, the purity and integrity of RNA was tested
by running on 1.2% agarose gel electrophoresis. Resid-
ual gDNA contaminating RNA extracts was removed
by DNase treatment (DNase I RNase-free, Thermo Sci-
enti c, USA). The qPCR with three rDNA-based primers
has recently been applied for DNA contamination assay
by using RNA as template, (Hashemi et al., 2016).
The cDNA was synthesized using the QuantiTect
reverse transcription kit (Qiagen) according to the man-
ufacturer’s instructions. In brief, 1 L (200 ng) of treated
RNA, 1 l of RT primer mix (blend of oligo-dT and ran-
dom primers), 1 µl Quantiscript Reverse Transcriptase
(contains RNase inhibitor), 4 l Quantiscript RT Buffer
5X (includes Mg
2+
and dNTPs) and 13 l of RNase-free
water were added and incubated at 65°C for 20 min and
then followed by incubation at 95°C for 3 min for inacti-
vation of reverse transcriptase. The nal cDNA reactions
were diluted 1:10, and stored at -20°C. Targets were
ampli ed by the Maxima SYBR Green/ROX qPCR Master
Mix (Thermo Scienti c) with two-step cycling in CFX96
real-time PCR instrument (Bio-Rad, USA) according to
the company’s suggestions. The reaction master mix
prepared by adding the following components: 1L of
cDNA (50 ng), 5 l of 2X SYBR Green Master Mix and
0.3 l of 10 M of each primers and 3.4 l of RNase-free
water. Thermal cycling were performed using two-step
cycling protocol according to the company’s procedures
as follow: 10 min initial activation step at 95° C followed
by 40 cycles of 95° C for 15 sec and 60° C for 1 min.
Data acquisition were performed during the anneal-
ing/extension step. After ampli cation, all PCR reac-
tions were subjected to a thermal melt with continuous
uorescence measurement from 55°C to 95°C for dis-
sociation curve analysis. Curves were analyzed by CFX
Manager (Bio-Rad) with single threshold cycle and sub-
tracted curve t method. At least one non-template con-
trol (NTC) was used for each primer pair master mix. The
threshold cycles (Ct) were automatically calculated for
all reactions in the plate using the CFX manager soft-
ware (Bio-Rad). All assays were carried out in three rep-
lications. The mean values for each assay were obtained,
and used for further analysis. The livak (2
–∆∆Ct
) method
(Livak and Schmittgen, 2001) were used for calculation
of relative gene expression ratio. RT2 Pro ler PCR Array
Data Analysis software (SABiosystems) was used to con-
struct vocalno plot and clusterogram.
RESULTS
BIOINFORMATIC ANALYSIS AND SELECTING
CANDIDATE ESTS
In our pervious study, 154 A. littoralis ESTs from four
different library were isolated by cDNA-AFLP method,
and used in this study. EST sequences were retrieved
through Entrez Gene -EST database- at the National
Centre for Biotechnology Information (NCBI). The four
libraries names were LIBEST_028119 (69 ESTs with
GenBank accession number of JK191110.1-JK191042.1),
LIBEST_027583 (25 ESTs with GenBank accession num-
ber of JK671243.1-JK671267.1), LIBEST_027584 (34
ESTs with GenBank accession number of JK671209.1-
JK671242.1), and LIBEST_027576 (26 ESTs with Gen-
Bank accession number of JK671176.1-JK671201.1).
All ESTs were evaluated by the CAP3 DNA sequence
assembly program. Assembling of the 154 ESTs produced
a total of 18 assembled contigs and 110 singletons. Of
the 129 assembled unique transcripts, 111 (86%) and 18
(14%) comprised of singletons and contigs, respectively.
A total of 129 non-redundant dataset were compared
to the GenBank non-redundant database using BLASTX

448 EXPRESSION ANALYSIS OF
AELUROPUS LITTORALIS
ESTS BIOSCIENCE BIOTECHNOLOGY RESEARCH COMMUNICATIONS
Hashemipetroudi et al.
to assign putative function. Of all aligned sequences,
58.9% could be assigned a putative identity, 20.9% with
hypothetical or unknown functions and 20.9% showed
no match with existing sequences. The size of most
ESTs (79%) ranged from 100 to 400 bp. Sequence simi-
larity searches using BLASTX were performed to com-
pare the selected ESTs to subset of non-redundant pro-
tein sequences (nr) of green plant (taxid: 33090), Oryza
sativa, Zea mays, Arabidopsis thaliana, Brachypodium
distachyon, Setaria italica and Sorghum bicolor with
several blast e-value cutoffs. We found that the A. litto-
ralis transcript set (129 ESTs) showed a greater number
of sequence similarity matches with Setaria italica and
Zea mays transcripts. Based on functional annotation,
41 ESTs were selected for relative expression analysis in
root and leaf tissues at different time-point of salt stress
and recovery condition. The primer features are listed in
Table 1.
DNA CONTAMINATION ASSAY
For DNA contamination assay, the RNA samples have
been tested by qPCR with. In our pervious study, a new
procedure for testing DNA contamination was explained
(Hashemi et al., 2016). To monitor residual gDNA con-
tamination in RNA sample, the total RNA samples were
examined by three rDNA-based primer pairs in qPCR.
Generally, observation of any band on the agarose gel
or melting curve peak in qPCR analysis were considered
as gDNA contamination. In this study, all RNA samples
were tested by this procedure, and DNase-free RNA was
used for cDNA synthesis.
PRIMER VALIDATION
The cDNA synthetized from control and treatment sam-
ples was also tested by qPCR. Pooled cDNA tissue sam-
ples containing equal amounts of the cDNA from con-
trol and treatment conditions were used to determine the
primer pairs annealing temperature and their speci c-
ity. Primers annealing temperature were adjusted to 55-
60°C, and their speci city was checked by melt curve
analysis and electrophoresis in 3% agarose gels. Single
sharp peak with no primer-dimer was used for relative
expression analysis. From 41 ESTs tested in the melt
curve analysis, three of the genes (C-NAD-MDH2, TTL,
SAP and PI/PC-TP) were not ampli ed and excluded
from further analysis. The sharp peak of 5PTASE11 was
only observed in root samples while no peak was detect-
able in leaf samples. The C
t
value of CHR11 in root time
point were higher than 35 and therefore excluded from
analysis. For RBPL39 and HP2 genes, sharp peak were
ampli ed only in leaf time points while unambiguous
TFC D peak was only observed in root tissue. The trend
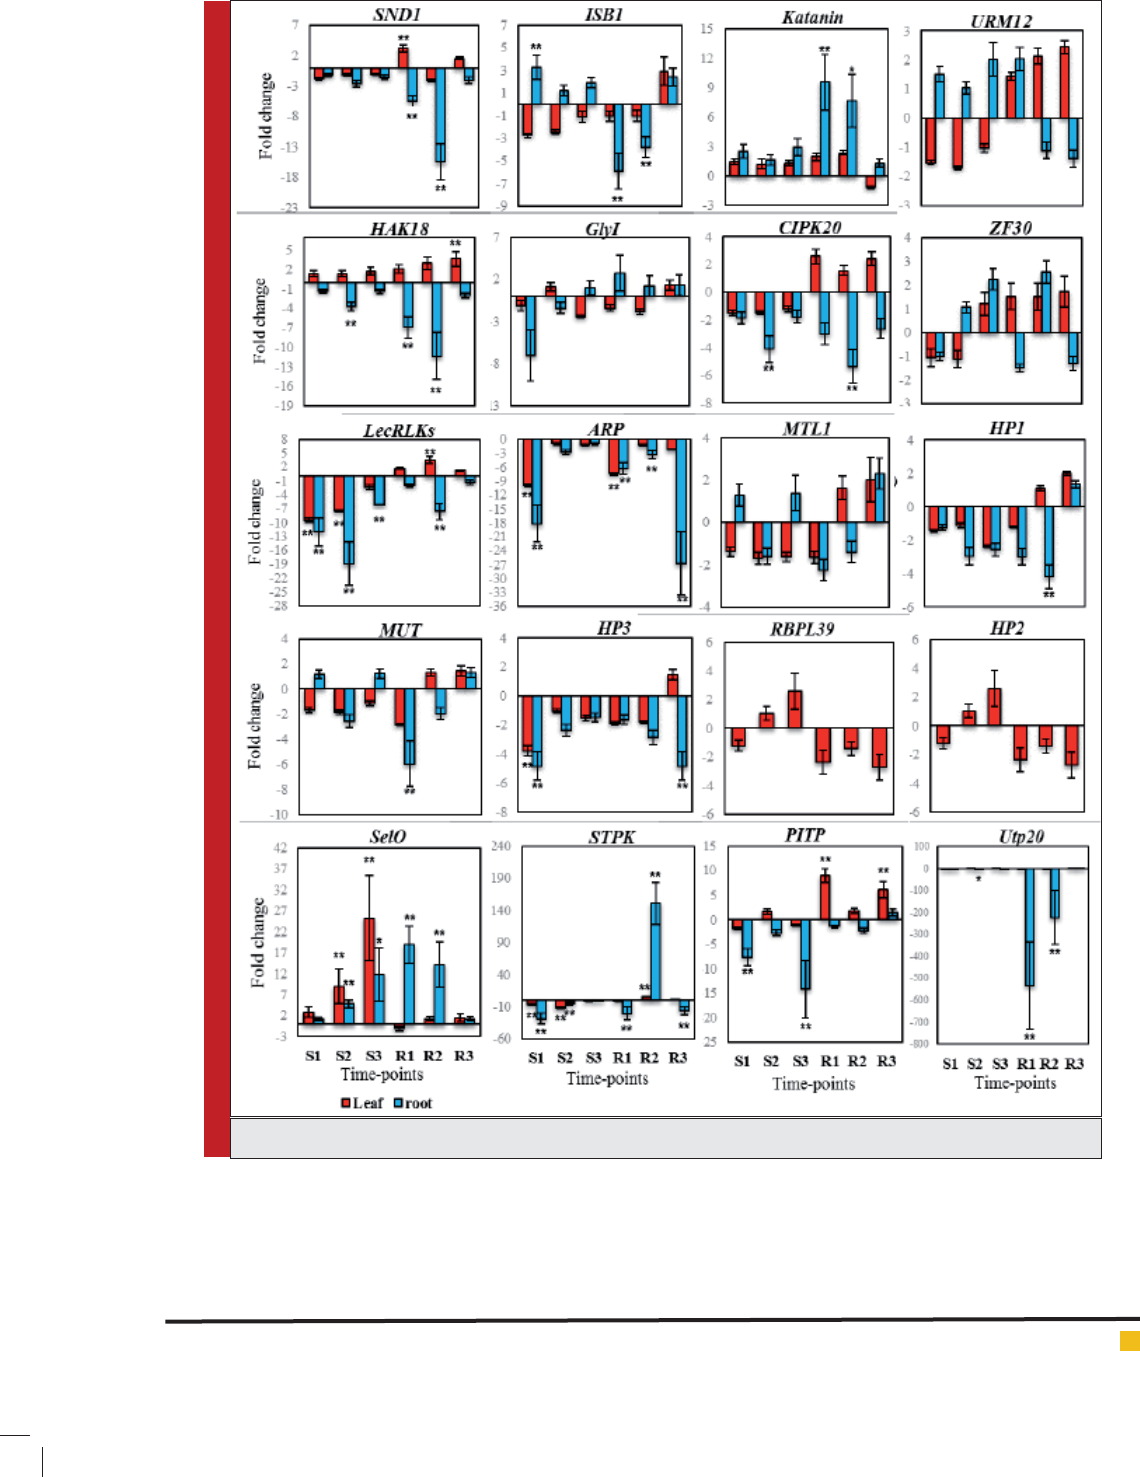
of regulated genes in root and leaf tissues are presented
in Figure 1.
ROOT TIME POINT ANALYSIS
Distribution of C
t
values ampli ed from root samples
showed that in control and salt stressed samples, C
t
value
of most genes were lower than 25. Percent distribution
of C
t
values in C
t
range of <25 in different time-points
including control. Salt Stress: S1, S2, S3, Recovery con-
dition: R1, R2 and R3 were 54.63%, 59.26%, 50.00%,
53.70%, 6.48%, 5.56% and 59.26%, respectively. These
values indicated that the mRNA level of most genes in
control and salt-stressed samples were higher than in
the mRNA level of recovered samples (except R3). For
normalization of expression levels in Aeluropus litto-
ralis, different set of reference genes as well as their
optimal number were recommended for root and leaf
samples (Hashemi et al., 2016).
The three genes namely, RPS3, EF1A and UBQ were
used as normalizer in root samples. For identi cation
of genes with statistically signi cant gene expression
changes, a volcano plot were used. Volcano plots are
used to look at fold change and statistical signi cance,
simultaneously (Allison et al., 2006).
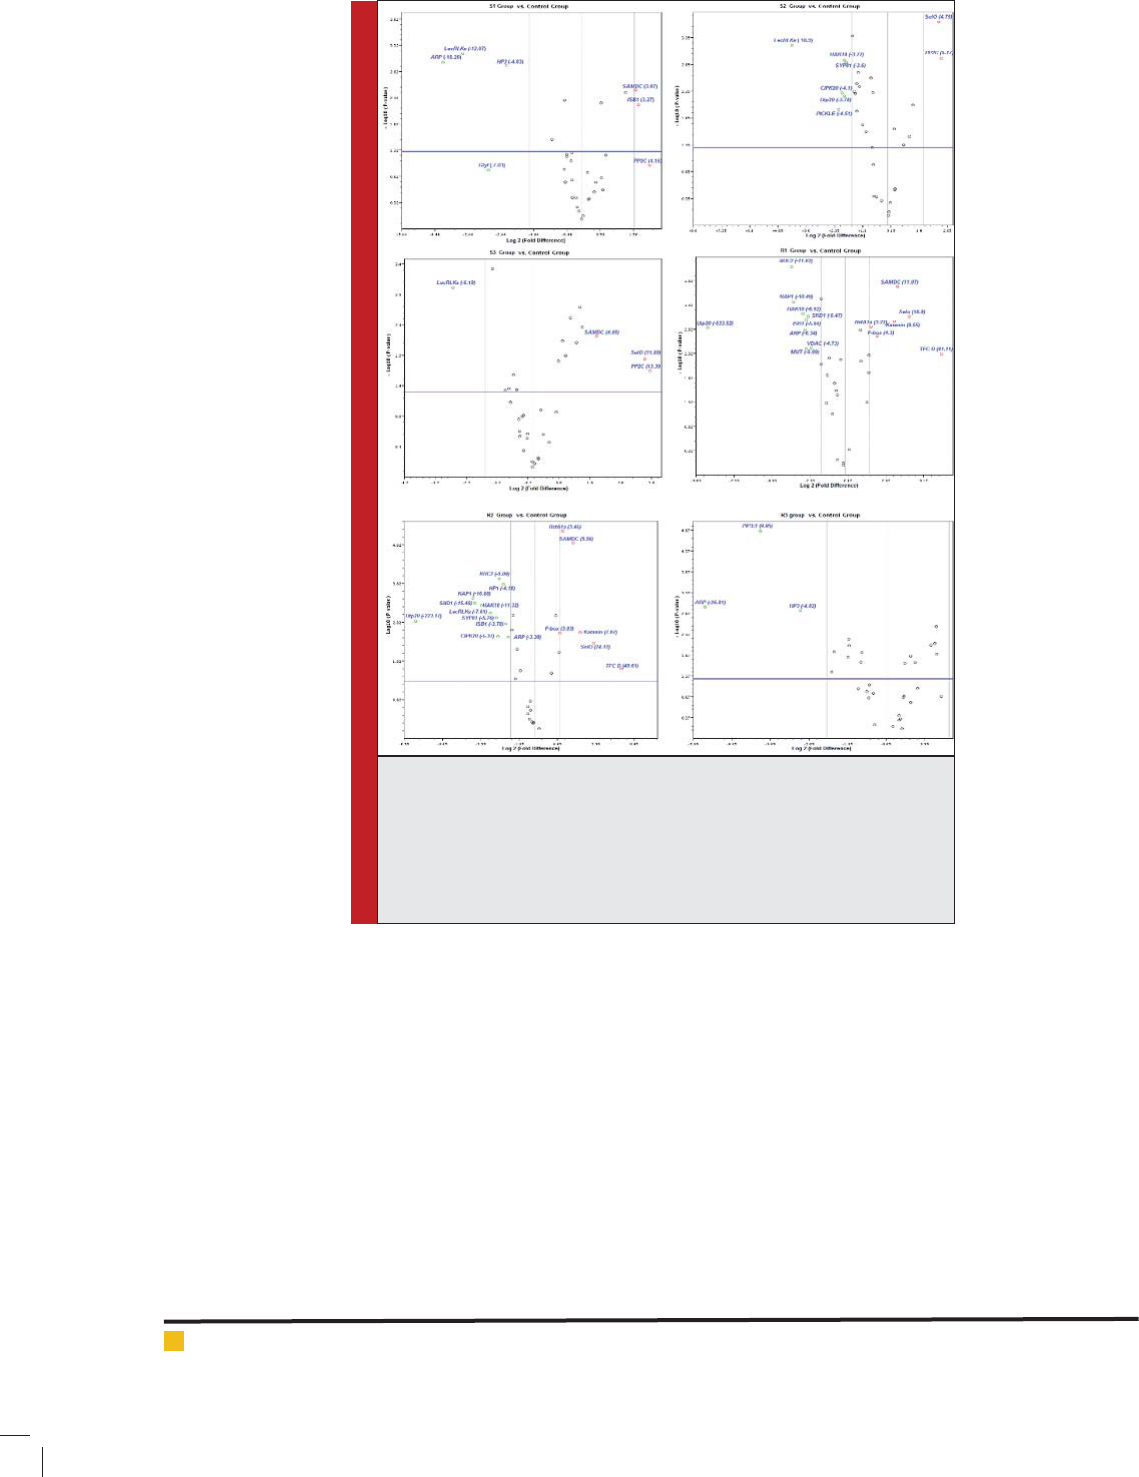
In this study, expression values of 31 genes across
six time point of root samples were compared to control
samples by volcano plots (Figure 2). Values above the
blue line and outside of the vertical lines were deter-
mined to statistically signi cant fold changes with 95%
con dence (=0.05). Genes with fold change higher
than 2 or lower than -2 and p-value < 0.05 are indicated
in blue in Figure 2.
Based on volcano plot analysis, seven genes includ-
ing ZF30, URM12, CAND1, SPIKE1, TBC1, HP1, MTL1
and 5PTASE had not signi cant difference relative to
control group. At time point S1, the expression level of
SAMDC (3.1) and ISB1 (3.3) were higher while LecRLKs
(-12.1), ARP (-18.2) and HP3 (-4.8) were downregulated
(p-value < 0.05). Despite of the expression level of PP2C
(4. 2) and GlyI (-7) were higher and lower than 2 and
-2, but their fold changes were not signi cant (value
inside parentheses is fold change). In S2 time point, two
gene of PP2C (5.7) and SelO (4.8) were signi cantly
upregulated while PICKLE (-4.5), Utp20 (-3.8), SYP81
(-3.6), CIPK20 (-4.1), HAK18 (-3.8) and LecRLKs (-18.9)
were signi cantly downregulated (p-value < 0.05). PP2C
(13.4) and SelO (11.9) and SAMDC (4.1) were upregu-
lated in S3 time point while LecRLKs (-6.2) were signi -
cantly downregulated.
Under recovery conditions at time point R1, the
expression level of HsfA1a (3.2), SelO (18.9), TFC D
(81.1), SAMDC (11.1), Katanin (9.5), F-box (4.3) were
increased relative to control while, the genes of Utp20

BIOSCIENCE BIOTECHNOLOGY RESEARCH COMMUNICATIONS EXPRESSION ANALYSIS OF
AELUROPUS LITTORALIS
ESTS 449
Hashemipetroudi et al.
Table 1: showing the primer features
Gene
symbol
Accession
number
Name Function E-value Sequence
PIP3;1 JZ191087 Plasma membrane intrinsic
protein
water channel activity 3e-63 TGTCATGGGCGTCTCCAAGT
GCAGTAGACGAGCGCGAAGA
VDAC3 JZ191051 Voltage dependent anion
channel 3
regulation of anion
transmembrane transport
1e-13 TCCAGACCCAGCTGAAGCAC
GCCTGGTACACCAAGATCCTCA
SYP81 JZ191048 Syntaxin of plants 81 Vesicle traf cking protein
that functions in the
secretory pathway.
2e-32 CAGCATGGCGTGGCTCTTAT
AGCATCTTGAAAGCGCATGG
NAP1 JZ191072 Nucleosome assembly
protein1
modulate chromatin structure
by regulation of nucleosome
assembly/disassembly
0.29 CAGGGCTCCACAAATCCAAC
ACGACCTGCTGAGTGCAAGC
CAND1 JZ191057 Cullin-associated and
neddylation-dissociated
promotes the exchange of the
substrate-recognition F-box
subunit in SCF complexes
2e-06 TGGCAGTGACTACAGCATACGG
ACTGCGCACAGAGCGGTACT
SAMDC JZ191058 S-adenosylmethionine
decarboxylase
Essential for polyamine
homeostasis, and normal
plant embryogenesis, growth
and development.
5e-14 CCATCCATGGTCCTGCTTTC
GGGTTGAAGCCCATGACCTC
Katanin JZ191064 Katanin p80 WD40 microtubule severing 1e-61 TGATCCCTCCCTTCCCAGTT
CCTGAGCGAATGCGTAAACC
F-box JZ191080 F-box protein Unknown 1e-60 TGCCCATGAACCATTGTACG
GCCCTGCAGATCAGGTCAAC
SND1 JZ191081 Staphylococcal nuclease
domain-containing protein
1-like
posttranscriptional gene
silencing by RNA, response
to salt stress
1e-18 GCGGATCTGGCAGTATGGAG
ACCGCTGCCTGAACAGACTT
GTF3C5 JZ191082 General transcription factor
3C polypeptide 5-like
Involved in RNA polymerase
III-mediated transcription
2e-37 TTCCAAGTGGCCATCAGGTT
AAAGGGCTTCCTGCCTCTTG
ISB1 JZ191092 Importin subunit beta-1 protein transporter activity 1e-42 GCTCCAGCCAAATGTCAAGC
GGTCTTGGTCAACAGCTTCAGG
NUC2 JZ191093 Nucleolin 2-like Involved in pre-rRNA
processing and ribosome
assembly
7e-06 AAGTCCAGTGTTGCGGTTGC
CCGCATTTCTCTTCCCCTTC
GlyI JZ191094 Glyoxalase I carbohydrate metabolic
process
0.079 GTGGCATGGACTTGCTACGG
CCGTGGCATCACAGAGGATT
CIPK20 JZ191099 CBL-interacting protein
kinase 20
protein serine/threonine
kinase activity
2e-09 CAGGAGATGAGGCCAGCACT
CTGTTGCTGTTGCTGCTTGG
HAK18 JZ191100 High-af nity potassium
transporter
potassium ion
transmembrane transporter
activity
7e-37 GGCCAGACATTTCAGACCACA
AGCCCTGATGACCGTGTTTC
ZF30 JZ191101 Zinc nger CCCH domain-
containing protein 30
regulation of transcription 3e-08 GCTCTTGTTGGCTCCCCTCT
TCACCATTTACGCCCCAATC
URM12 JZ191103 Ubiquitin-related modi er 12 involved intRNA
modi cation
4e-17 ACTGCGATTGGGAGCTGTGT
CGTGGAGATGAAGACCACCA
5PTASE11 Jk671224 Inositol polyphosphate
5-phosphatase
response to abscisic acid,
response to auxin, response
to jasmonic acid
6e-11 CACATGGAACATGAATGGCAAG
TGAACTCCTTGCTCCGAAAAGA
PITP Jk671260 Sec14p-like
phosphatidylinositol transfer
family protein
transporter activity 3e-55 GAAAGTAAAGATTGCGGAGAC
GGGTGCGAACTCTGAAAC
SPIKE1 Jk671264 DOCK family guanine
nucleotide exchange factor
vesicle-mediated transport 1e-24 TAAACAACACGGTGGCAGGTA
GCTCCCCATCAAATGTCCATA
TBC1 Jk671226 TBC1 domain family member
5 homolog B
act as a GTPase-activating
protein for Rab family
protein(s)
3e-18 CGGGATGGGAGCAACAAC
CACGGATAAGGGCACTGGT

450 EXPRESSION ANALYSIS OF
AELUROPUS LITTORALIS
ESTS BIOSCIENCE BIOTECHNOLOGY RESEARCH COMMUNICATIONS
Hashemipetroudi et al.
TTL Jk671266 tubulin-tyrosine ligase cellular protein modi cation
process
1e-05 AAGAGGCAGTATCCTAATCAC
AAACTCATTCTGCCAATCTA
KCNK12 Jk671259 potassium channel subfamily
K, member 12
potassium ion
transmembrane transport
1.5 TCGGAATCTGCCCTGAATCT
TATGTATCCCGGTCCACCACT
LecRLKs JK671176 G-type lectin S-receptor-like
serine/threonine-protein
kinase
Protein kinase activity 5e-16 CGGCCGACAATGGGTGAAG
GGGCATGCCAACCTCCTGTAG
SAP JK671180 Putative senescence-
associated protein
- 2e-11 TGACACACCCCACACATACAA
GGTTTAGACCGTCGTGAGACAG
ARP JK671182 Auxin-repressed protein - 6e-08 GGAAGTTTTGGGCTGTCTTTA
ATTTCGATGTTGCCTACTCTCTA
HP1 JK671187 Hypothetical protein1 Similar to F-box family
protein
1.5 CCAACAACTCAGCTCCAA
GATGTGAAAATAAGCACGCTA
MTL1 JK671192 Mitochondrial translation
factor 1
Mitochondrial protein
translation and group II
intron splicing
6e-50 ATTTCGGCAAAAGGAATGGAG
GAAGCTTGATGAGGCGACAGA
HP2 JK671195 Hypothetical protein2 - 0.006 GTTTGGGCATTGGGTCCTCAAGT
CGAGCAACAGCAGCAAGAGCAC
MUT JK671196 Mutator-like transposase Transposable element gene 3e-18 GATGCCCATCTTGACAATAC
GCAGTGGGGAAGTTGATTT
HP3 JK671200 Hypothetical protein3 - 0.003 GGAAGTTTTGGGCTGTCTTTAC
AGATTTCGATGTTGCCTACTCTC
HsfA1a Jk671211 heat shock factor A1a transcription factor activity 4e-10 GCAGTGCCCAGTTGTCTT
TTGGGCCTGGTGTCATA
PP2C Jk671236 Protein phosphatase 2C protein serine/threonine
phosphatase activity
6e-34 TAATATGCAGGGGAGGAAA
CAGCGAGTACACCACCAA
C-NAD-
MDH2
Jk671223 Malate dehydrogenase Cytosolic-NAD-dependent
malate dehydrogenase 2
4e-20 AAAACGTCGTTCAAAGAG
GCCATAAGATCCGTCAG
5PTASE11 Jk671224 Inositol polyphosphate
5-phosphatase
response to abscisic acid,
response to auxin, response
to jasmonic acid
6e-11 CACATGGAACATGAATGGCAAG
TGAACTCCTTGCTCCGAAAAGA
HsfA1a Jk671211 heat shock factor A1a transcription factor activity 4e-10 GCAGTGCCCAGTTGTCTT
TTGGGCCTGGTGTCATA
PP2C Jk671236 Protein phosphatase 2C protein serine/threonine
phosphatase activity
6e-34 TAATATGCAGGGGAGGAAA
CAGCGAGTACACCACCAA
C-NAD-
MDH2
Jk671223 Malate dehydrogenase Cytosolic-NAD-dependent
malate dehydrogenase 2
4e-20 AAAACGTCGTTCAAAGAG
GCCATAAGATCCGTCAG
PI/PC-TP Jk671213 Putative
phosphatidylinositol/
phosphatidylcholine transfer
protein SFH8-like
phosphatidylinositol
transporter activity,
transporter activity
6e-13 TTGGCACATGCTTCCACATC
AGGACTGCCCCATCCATCAT
PICKLE Jk671232 CHD3-type chromatin-
remodeling factor
DNA helicase activity 1e-37 AGGGGTATGCTGAACTTGT
CACCTTCGCCTCAATAA
RBPL39 Jk671237 RNA-binding protein 39-like mRNA processing 3e-05 GGTGCCACTGGTCTGA
AAAGGGGAAGCTACAGGAG
SelO Jk671243 Selenoprotein O-like transferase activity 3e-13 TCAAGGGTAGCGGAAAGAC
GGATGCTGCTGCGTAGAAC
TFC D Jk671246 tubulin folding cofactor D GTPase activator activity 4e-25 TAAAAGATGCCGCAACATA
GAAGGTGGGGAGCAAG
CHR11 Jk671250 chromatin-remodeling
protein 11
ATP-dependent chromatin
remodeling, nucleosome
binding
7e-119 CGCTGTTTTCTCTTTGATT
CGCTTTTGCCCTATTCTA
Utp20 Jk671251 small subunit processome
component 20 homolog
rRNA processing, associates
with U3 snoRNA.
2e-60 -CTTTCAGTTGCGTTTAGATGT
CGCTTTCAGAAGTGATAAGG
STPK Jk671258 Serine/threonine-protein
kinase ULK4-like
protein kinase activity 1e-32 CATTTTCTGCCACTGTATCCT
ACTTTTACACAACCATGCTCC
BIOSCIENCE BIOTECHNOLOGY RESEARCH COMMUNICATIONS EXPRESSION ANALYSIS OF
AELUROPUS LITTORALIS
ESTS 451
Hashemipetroudi et al.
(-533.5), VDAC3 (-4.7), SND1 (-5.5), NAP1 (-10.5), ISB1
(-5.9), NUC2 (-11.7), HAK18 (-6.9), ARP (-6.3), MUT
(-5.9) showed downregulation in mRNA level. The genes
found to be upregulated at time point R2 were similar
to that of time point R1. HsfA1a (3.4), SelO (14.1), TFC
D (49.6), SAMDC (5.5), Katanin (7.6), F-box (3) showed
upregulation in R2 time point. A number of eleven genes
including Utp20 (-223.1), SYP81 (-5.7), SND1 (-15.4),
FIGURE 1: Trend of regulated genes during different time point of salt stress and recovery condition.
452 EXPRESSION ANALYSIS OF
AELUROPUS LITTORALIS
ESTS BIOSCIENCE BIOTECHNOLOGY RESEARCH COMMUNICATIONS
Hashemipetroudi et al.
FIGURE 2: Volcano plots of the fold changes and p-values distribution. A
total number of 31 genes were tested in the root salt-stressed and recov-
ered samples. The central vertical line represents a fold change of 1 (no
change) and two another vertical lines represent 2 fold upregulation or
downregulation cutoffs. The horizontal blue line represents the p-value
cutoff for identi cation of genes that are statistically signi cant. Value
inside parentheses is fold change.
NAP1 (-16.8), ISB1 (-3.7), NUC2 (-5), CIPK20 (-5.3),
HAK18 (-11.3), LecRLKs (-7.6), ARP (-3.3), HP1 (-4.1)
showed downregulation in R2 time point. In the R3 time
point, three genes of PIP1;3 (-9.9), ARP (-26.8) and HP3
(-4.8) only showed downregulation in mRNA level.
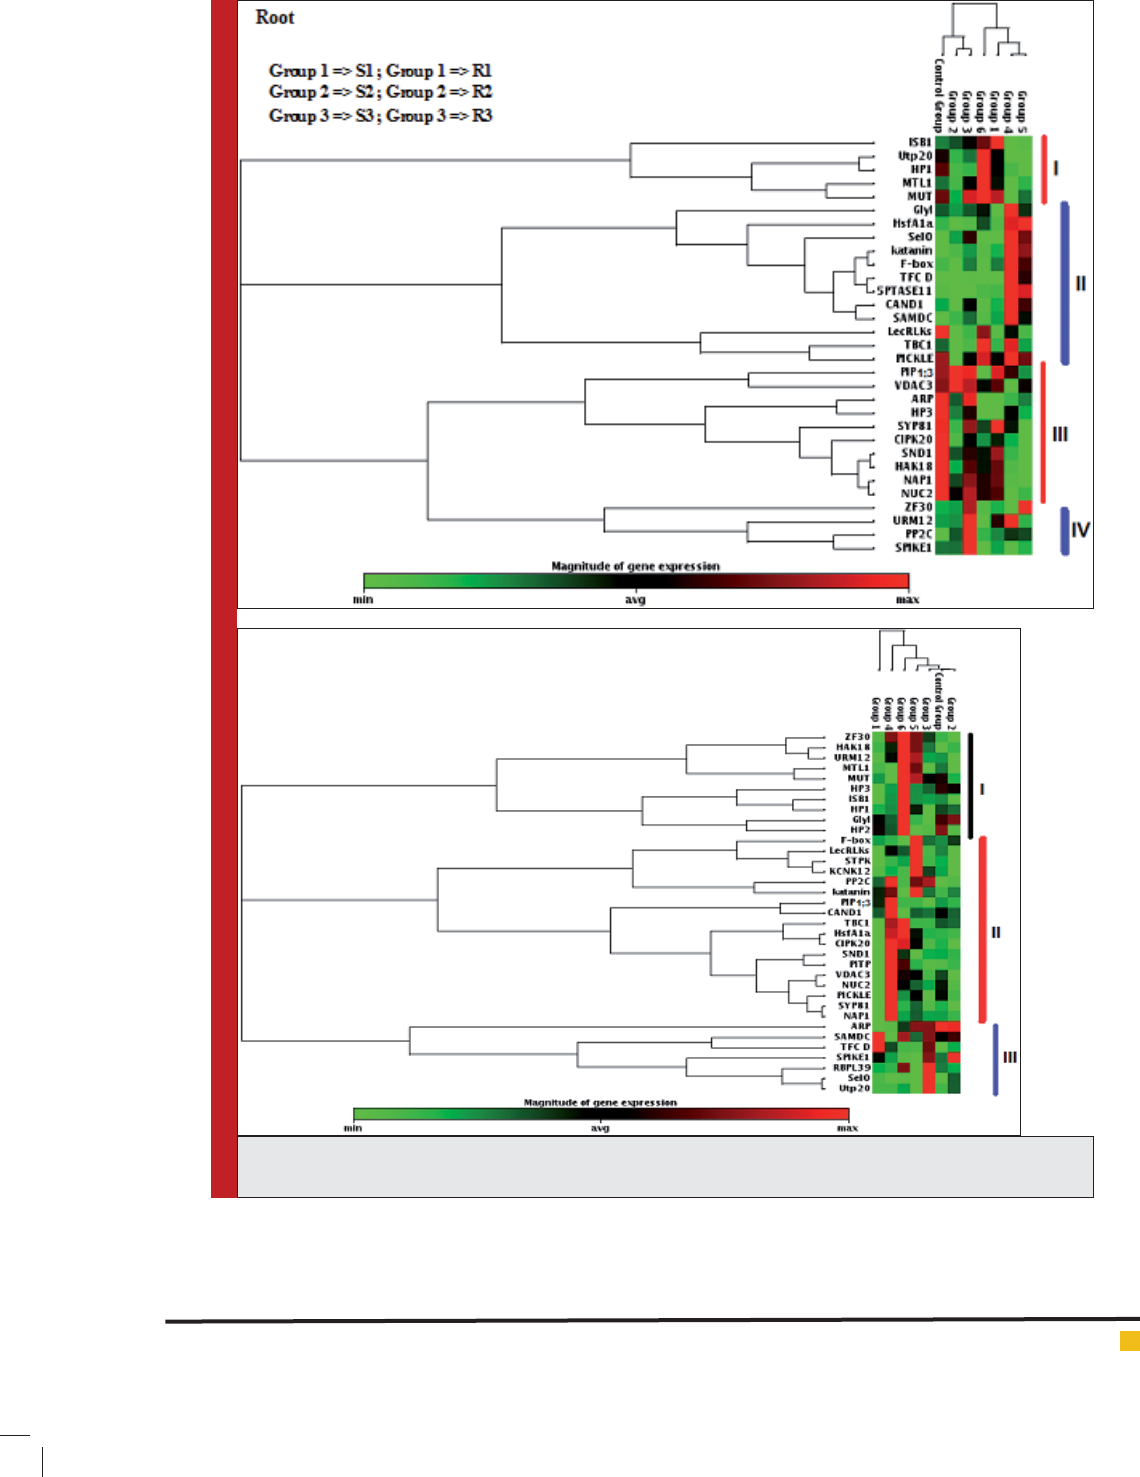
Visualization of gene expression differences among
different time point was done by RT2 Pro ler PCR
Array Data Analysis program (Figure 3 A). The result
of the cluster analysis is depicted in a clustergram that
shows all 31 genes analyzed and the magnitude each
is expressed in control and 6 different root time points
including group 1 (S1), group 2 (S2), group 3 (S3), group
4 (R1), group 5 (R2), group 6 (R3). Four major clusters of
genes were observed: cluster I and II contained upregu-
lated genes and cluster III and IV contained downregu-
lated genes.
LEAF TIME POINTS ANALYSIS
Distribution of Ct values in leaf samples showed that the
most of genes had Ct range of 25-30. Percent of Ct values
in range of 25-30 in different time-points including control,
S1, S2, S3, R1, R2 and R3 time-points were 57.41%, 61.11%,
42.59%, 48.15%, 50.00%, 45.37% and 54.63%, respectively.
Comparing of Ct values in root and leaf samples showed
that the mRNA level in root samples were higher than leaf
samples. The geometric mean of U2SURP and GTF Ct val-
ues were chosen as normalizer in leaf samples.
BIOSCIENCE BIOTECHNOLOGY RESEARCH COMMUNICATIONS EXPRESSION ANALYSIS OF
AELUROPUS LITTORALIS
ESTS 453
Hashemipetroudi et al.
FIGURE 3: Clustergram of the magnitude of gene expression for 31 genes analyzed. Light green represents
minimal gene expression, and red indicated maximum gene expression as indicated by the legend.

454 EXPRESSION ANALYSIS OF
AELUROPUS LITTORALIS
ESTS BIOSCIENCE BIOTECHNOLOGY RESEARCH COMMUNICATIONS
Hashemipetroudi et al.
Similar to root analysis, expression values of 31
genes across 6 time point of leaf samples were com-
pared to control samples by volcano plots (Plots have
not shown). Based on volcano plot analysis, expres-
sion level of 18 genes including ZF30, URM12, TBC1,
HP1, MTL1, PICKLE, PIP1;3, VDAC3, SYP81, NAP1,
CAND1, SAMDC, Katanin, F-box, ISB1, GlyI, CIPK20,
HP2, MUT, RBPL39, SPIKE1 were unchanged relative
to control group in different leaf time point.
In S1 time point, PP2C (3.4) were upregulated while
NUC2 (-3.3), LecRLKs (-9.5), ARP (-9.9) and HP3 (-3.8)
and STPK (-6.7) were signi cantly downregulated
(p-value < 0.05). In S2 time point, SelO (8.9) were sig-
ni cantly upregulated while LecRLKs (-7.5), STPK
(-12.3) and KCNK12 (-4.7) were signi cantly downregu-
lated. In S3 time point, only upregulation of PP2C (3.4),
SelO (8.9) and Utp20 (-533.5) were observed among all
analyzed genes. PP2C (3.4), SND1 (3.1) and PITP (8.9)
showed upregulation in R1 time point while ARP (-7.5)
were signi cantly downregulated. In the R2 time point,
the expression level of PP2C (6.5), LecRLKs (3.5), STPK
(5.1) and KCNK12 (4.1) were signi cantly were increased
relative to control. Finally, HsfA1a (3.4), HAK18 (-6.9),
PITP (8.9) showed upregulation in R3 time point. The leaf
clustergram were presented in Figure 3 B. Three major
clusters of genes were observed. The most signi cantly
up or down-regulated genes allocated into cluster II. This
cluster represents genes reacting to recovery conditions.
DISCUSSION
The development of salt or drought-adopt crops either
through the use of the crops wild relatives as genetic
resources or domestication of naturally tolerant spe-
cies have been proposed as a strategy to face with the
environmental challenges. Halophytes as crops naturally
salt-tolerant species are now being promoted in agri-
culture, particularly to provide forage, medicinal plants,
aromatic plants (Flowers et al., 2010). Although, improv-
ing crop salt tolerance by genetic engineering is not
easy, halophyte germplasm can furnish “climate-ready”
genes for plant breeding program (Jaradat, 2010). Differ-
ent aspects of A. littoralis properties such as life style,
morphological, anatomical, ecological, physiological
and molecular characteristics have been investigated so
far (Hashemi et al., 2013, Hashemi-Petroudi et al., 2014).
In the present study, we have focused on gaining
insight on differential regulation of some responsive ESTs
in response to salt stress and recovery condition. Expres-
sion pattern of 41 selected ESTs were estimated by qPCR
in root and leaf tissue. In the root, the genes of SAMDC,
ISB1 (6hrs), PP2C and SelO, HsfA1a, TFC D, Katanin,
F-box were signi cantly up-regulated relative to con-
trol while LecRLKs, ARP, HP3, PICKLE, Utp20, SYP81,
CIPK20, HAK18, VDAC3, SND1, NAP1, ISB1 (6hrs and
24hrs), NUC2, MUT, HP1 and PIP1;3 showed down-reg-
ulation in given conditions. In the case of leaf tissue, the
genes of PP2C, SelO, Utp20, SND1, PITP, LecRLKs, STPK,
KCNK12, HsfA1a, HAK18, NUC2, ARP, HP3 and ARP
were signi cantly up- or down-regulated. Interestingly,
expression of some genes was induced by salt stress while
also signi cantly repressed by recovery condition. Here
interestingly the transcriptional regulator HsfA1a could
be found. HsfA1a was formerly described to be a main
component of the heat and drought stress response (Liu et
al., 2013, Wang et al., 2015).
In this study, the protein phosphatase 2C (PP2C)
were activated in salt stress and recovery condition. The
PP2Cs from various organisms have been implicated to
act as negative modulators of protein kinase pathways
involved in diverse environmental stress responses and
developmental processes (Xue et al., 2008). The SYP81
showed down regulation in given conditions. Syntax-
ins (with the exception of syntaxin 11) are transmem-
brane proteins which their functions respect to organ-
ism growth, physiology and development are not well
known (Teng et al., 2001). The coexpression analysis
showed that, the most signi cantly up or down-regu-
lated genes allocated into cluster II (leaf tissue). Genes
found in Cluster II are interesting candidates for physi-
ological reactions related to the recovery of the plant
after salt stress. This cluster represents genes reacting to
recovery conditions.
CONCLUSION
In this study we bioinformatically analyzed the 154 ESTs
from A. littoralis and the functionally annotation showed
that 58.9% of ESTs had a putative function, 20.9% were
hypothetical or unknown functions and 20.9% showed
no match with existing sequences. The qPCR expression
analysis of 41 selected ESTs showed different regula-
tion in leaf and root tissue. The gene expression pro l-
ing has done in this study will also provide insight into
the role of selected ESTs in different time points of salt
stress and recovery condition. Differential regulation of
these genes also point at their role in salt stress tolerance
in plant. These information facilitate understanding the
molecular mechanisms of stress related genes and could
be used as valuable starting point for further research
on these genes.
REFERENCES
A garwal, M., Shrivastava, N. & Padh, H. (2008). Advances In
Molecular Marker Techniques And Their Applications In Plant
Sciences. Plant Cell Reports, 27, 617-631.

BIOSCIENCE BIOTECHNOLOGY RESEARCH COMMUNICATIONS EXPRESSION ANALYSIS OF
AELUROPUS LITTORALIS
ESTS 455
Hashemipetroudi et al.
A glawe, S., Fakrudin, B., Patole, C., Bhairappanavar, S., Koti,
R. & Krishnaraj, P. (2012). Quantitative Rt-Pcr Analysis Of 20
Transcription Factor Genes Of Mads, Arf, Hap2, Mbf And Hb
Families In Moisture Stressed Shoot And Root Tissues Of Sor-
ghum. Physiology And Molecular Biology Of Plants, 18, 287-
300.
A llison, D. B., Cui, X., Page, G. P. & Sabripour, M. (2006.)
Microarray Data Analysis: From Disarray To Consolidation
And Consensus. Nature Reviews Genetics, 7, 55-65.
B achem, C. W., Hoeven, R. S., Bruijn, S. M., Vreugdenhil, D.,
Zabeau, M. & Visser, R. G. (1996) Visualization Of Differential
Gene Expression Using A Novel Method Of Rna Fingerprinting
Based On A p: Analysis Of Gene Expression During Potato
Tuber Development. The Plant Journal, 9, 745-753.
B arhoumi, Z., Djebali, W., Chaïbi, W., Abdelly, C. & Smaoui, A.
(2007). Salt Impact On Photosynthesis And Leaf Ultrastructure
Of Aeluropus littoralis. Journal Of Plant Research, 120, 529-
537.
Be n-Saad, R., Ben-Ramdhan, W., Zouari, N., Azaza, J., Mieulet,
D., Guiderdoni, E., Ellouz, R. & Hassairi, A. (2012). Marker-
Free Transgenic Durum Wheat Cv. Karim Expressing The
Alsap Gene Exhibits A High Level Of Tolerance To Salin-
ity And Dehydration Stresses. Molecular Breeding, 30, 521-
533.
Br enner, S., Johnson, M., Bridgham, J., Golda, G., Lloyd, D. H.,
Johnson, D., Luo, S., Mccurdy, S., Foy, M. & Ewan, M. (2000).
Gene Expression Analysis By Massively Parallel Signature
Sequencing (Mpss) On Microbead Arrays. Nature Biotechnol-
ogy, 18, 630-634.
Bu stin, S. A. (2000). Absolute Quanti cation Of Mrna Using
Real-Time Reverse Transcription Polymerase Chain Reaction
Assays. Journal Of Molecular Endocrinology, 25, 169-193.
Cu shman, J. C. & Bohnert, H. J. (2000) Genomic Approaches
To Plant Stress Tolerance. Current Opinion In Plant Biology,
3, 117-124.
Di atchenko, L., Lau, Y., Campbell, A. P., Chenchik, A., Moq-
adam, F., Huang, B., Lukyanov, S., Lukyanov, K., Gurs-
kaya, N. & Sverdlov, E. D. (1996). Suppression Subtractive
Hybridization: A Method For Generating Differentially Reg-
ulated Or Tissue-Speci c Cdna Probes And Libraries. Pro-
ceedings Of The National Academy Of Sciences, 93, 6025-
6030.
Fa temi, F., Nematzadeh, G., Askari, H. & Hashemi, H.(2016) Dif-
ferential Gene Expression Of Aeluropus Littoralis In Response
To Nacl.Unpublished data.
Fl owers, T. J., Galal, H. K. & Bromham, L. (2010). Evolution Of
Halophytes: Multiple Origins Of Salt Tolerance In Land Plants.
Functional Plant Biology, 37, 604-612.
Gr acey, A. Y. 2007. Interpreting Physiological Responses To
Environmental Change Through Gene Expression Pro ling.
Journal Of Experimental Biology, 210, 1584-1592.
Gu tierrez, L., Mauriat, M., Pelloux, J., Bellini, C. & Van
Wuytswinkel, O. (2008). Towards A Systematic Validation Of
References In Real-Time Rt-Pcr. The Plant Cell Online, 20,
1734-1735.
Ha shemi-Petroudi, S. H., Nematzadeh, G., Askari, H. & Gha-
hary, S. (2014). Involvement Of Cytosine Dna Methylation In
Different Developmental Stages Of Aeluropus littoralis. Jour-
nal Of Plant Molecular Breeding, 2, 56-67.
Ha shemi, S. H., Nematzadeh, G., Ahmadian, G., Yamchi, A. &
Kuhlmann, M. (2016). Identi cation And Validation Of Aeluro-
pus littoralis Reference Genes For Quantitative Real-Time Pcr
Normalization. Journal Of Biological Research-Thessaloniki,
23, 1.
Ha shemi, S. H., Nematzadeh, G., Askari, H. & Ghasemi, Y.
(2013). Pattern Of Dna Cytosine Methylation In Aeluropus lit-
toralis During Temperature Stress. Journal Of Plant Molecular
Breeding, 1, 16-24.
Ho agland, D. R. & Arnon, D. I. (1950. The Water-Culture
Method For Growing Plants Without Soil. Circular. California
Agricult)ural Experiment Station, 347.
Hu bank, M. & Schatz, D. (1994) Identifying Differences In
Mrna Expression By Representational Difference Analysis Of
Cdna. Nucleic Acids Research, 22, 5640-5648.
Ja radat, A. A. (2010). Genetic Resources Of Energy Crops: Bio-
logical Systems To Combat Climate Change. Australian Journal
Of Crop Science, 4, 309.
Li u, Y., Zhang, C., Chen, J., Guo, L., Li, X., Li, W., Yu, Z., Deng,
J., Zhang, P., Zhang, K. & Zhang, L. (2013). Arabidopsis Heat
Shock Factor Hsfa1a Directly Senses Heat Stress, Ph Changes,
And Hydrogen Peroxide Via The Engagement Of Redox State.
Plant Physiol Biochem, 64, 92-8.
Li vak, K. J. & Schmittgen, T. D. (2001). Analysis Of Relative
Gene Expression Data Using Real-Time Quantitative Pcr And
The 2− ∆ct Method. Methods, 25, 402-408.
Mesléa rd, F., Ham, L. T., Boy, V., Van Wijck, C. & Grillas, P.
(1993). Competition Between An Introduced And An Indig-
enous Species: The Case Of Paspalum paspalodes (Michx)
Schribner And Aeluropus ittoralis (Gouan) In The Camargue
(Southern France). Oecologia, 94, 204-209.
Mittler , R. & Blumwald, E. (2010). Genetic Engineering For
Modern Agriculture: Challenges And Perspectives. Annual
Review Of Plant Biology, 61, 443-462.
Murashi ge, T. & Skoog, F. (1962). A Revised Medium For Rapid
Growth And Bio Assays With Tobacco Tissue Cultures. Physi-
ologia Plantarum, 15, 473-497.
Patnaik , D. & Khurana, P. (2001). Wheat Biotechnology: A
Minireview. Electronic Journal Of Biotechnology, 4, 7-8.
Pitman, M. G. & Läuchli, A. (2002). Global Impact Of Salinity
And Agricultural Ecosystems. Salinity: Environment-Plants-
Molecules. Springer.
Priya, A ., Tripathi, H., Yadav, D. K., Khan, F., Gupta, V., Shukla,
R. K. & Darokar, M. (2012). Functional Annotation Of Expressed
Sequence Tags Of Papaver somniferum. Plant Omics, 5,
223.
Rabbani, M. A., Maruyama, K., Abe, H., Khan, M. A., Katsura,
K., Ito, Y., Yoshiwara, K., Seki, M., Shinozaki, K. & Yamaguchi-
Shinozaki, K. (2003). Monitoring Expression Pro les Of Rice
Genes Under Cold, Drought, And High-Salinity Stresses And

456 EXPRESSION ANALYSIS OF
AELUROPUS LITTORALIS
ESTS BIOSCIENCE BIOTECHNOLOGY RESEARCH COMMUNICATIONS
Hashemipetroudi et al.
Abscisic Acid Application Using Cdna Microarray And Rna
Gel-Blot Analyses. Plant Physiology, 133, 1755-1767.
Rozen, S . & Skaletsky, H. (1999). Primer3 On The Www For
General Users And For Biologist Programmers. Bioinformatics
Methods And Protocols. Springer.
Saad, R. B., Romdhan, W. B., Zouari, N., Azaza, J., Mieulet, D.,
Verdeil, J.-L., Guiderdoni, E. & Hassairi, A. (2011). Promoter Of
The Alsap Gene From The Halophyte Grass Aeluropus litto-
ralis Directs Developmental-Regulated, Stress-Inducible, And
Organ-Speci c Gene Expression In Transgenic Tobacco. Trans-
genic Research, 20, 1003-1018.
Saad, R. B., Zouari, N., Ramdhan, W. B., Azaza, J., Meynard,
D., Guiderdoni, E. & Hassairi, A. (2010) Improved Drought And
Salt Stress Tolerance In Transgenic Tobacco Overexpressing A
Novel A20/An1 Zinc-Finger “Alsap” Gene Isolated From The
Halophyte Grass Aeluropus littoralis. Plant Molecular Biology,
72, 171-190.
Teng, F. Y. H., Wang, Y. & Tang, B. L. (2001). The Syntaxins.
Genome Biology, 2, 1.
Umezawa, T., Mizuno, K. & Fujimura, T. (2002). Discrimina-
tion Of Genes Expressed In Response To The Ionic Or Osmotic
Effect Of Salt Stress In Soybean With CdnaA p. Plant, Cell &
Environment, 25, 1617-1625.
Velculesc u, V. E., Zhang, L., Vogelstein, B. & Kinzler, K. W. (1995).
Serial Analysis Of Gene Expression. Science, 270, 484-487.
Wang, R. (2004). Plant Functional Types And Their Ecological
Responses To Salinization In Saline Grasslands, Northeastern
China. Photosynthetica, 42, 511-519.
Wang, Y., Cai, S., Yin, L., Shi, K., Xia, X., Zhou, Y., Yu, J. &
Zhou, J. (2015) Tomato Hsfa1a Plays A Critical Role In Plant
Drought Tolerance By Activating Atg Genes And Inducing
Autophagy. Autophagy, 11, 2033-2047.
Xue, T., Wang, D., Zhang, S., Ehlting, J., Ni, F., Jakab, S.,
Zheng, C. & Zhong, Y. (2008). Genome-Wide And Expression
Analysis Of Protein Phosphatase 2c In Rice and Arabidopsis.
Bmc Genomics, 9, 1.
Yamaguchi , T. & Blumwald, E. (2005). Developing Salt-Toler-
ant Crop Plants: Challenges And Opportunities. Trends In Plant
Science, 10, 615-620.
Zhang, Z. , Schwartz, S., Wagner, L. & Miller, W. (2000) A
Greedy Algorithm For Aligning Dna Sequences. Journal Of
Computational Biology, 7, 203-214.